import numpy as np
import matplotlib.pyplot as plt
polyfit
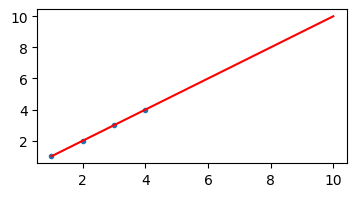
Objective is to create a fit of a set of data points and plot it.
1 degree polynomial
x = np.array([1, 2, 3, 4])
y = np.array([1, 2, 3, 4])
fit = np.polyfit(x, y, 1)equation = np.poly1d(fit)x_points = np.linspace(1, 10, 100)
y_points = equation(x_points)plt.figure(figsize=(4, 2))
plt.plot(x, y, '.')
plt.plot(x_points, y_points, '-r')[<matplotlib.lines.Line2D at 0x14c8564d0>]
2 degree polynomial
degree_2_fit = np.polyfit(x, y, 2)degree_2_eq = np.poly1d(degree_2_fit)print(degree_2_eq) 2
-4.958e-16 x + 1 x - 2.442e-15
y_points = degree_2_eq(x_points)plt.figure(figsize=(4, 2))
plt.plot(x, y, '.', x_points, y_points, '-r')[<matplotlib.lines.Line2D at 0x14c7af670>,
<matplotlib.lines.Line2D at 0x14c7afcd0>]
