Goal
Understanding polynomials handling methods of numpy.
Includes
- poly1d
- polyval
- polyfit
import numpy as nppoly1d
Creates a polynomial
Creating polynomial
# Creating polynomial of order 1
# 2x + 1
pol = np.poly1d([2, 1])
print(pol)
2 x + 1
# Creating a polynomal of order 2
# 2x^2 + 3x + 4
pol = np.poly1d([2, 3, 4])
print(pol)
2
2 x + 3 x + 4
Evaluation
# Evaluating pol with x = 2
print(pol)
print(pol(2))
print(pol([2, 3, 4]))
2
2 x + 3 x + 4
18
[18 31 48]
Arithmetic operations
# addition of pols

print(pol + pol)

# multiplication
print(pol * pol)

# division

print(pol / pol) # returns quotient and remainder

# square pols
print(pol ** 3)
2
4 x + 6 x + 8
4 3 2
4 x + 12 x + 25 x + 24 x + 16
(poly1d([1.]), poly1d([0.]))
6 5 4 3 2
8 x + 36 x + 102 x + 171 x + 204 x + 144 x + 64
polyval
np.polynomial.polynomial.polyval([1,2,3, 4], [2, 3, 4])array([ 9., 24., 47., 78.])
print(pol(4))48
Issue?
print(pol)
print(pol(2))
print(np.polynomial.polynomial.polyval(2, pol))
# why both evaluations result different values?
2
2 x + 3 x + 4
18
24.0
polyfit
polyfit is used to find the cofficient of a polynomial that best fits the given data points.
For example, there are data points such as and we need to find a polynomial that best fit these data points, we can use polyfit numpy method
How it finds the best fit polynomial?
numpy.polyfit uses least squares method.
# data points
x = np.array([1, 2, 3, 4], dtype="int64")
y = np.array([2, 3, 5, 7], dtype="int64")
# finding the coefficients using polyfit
coef = np.polynomial.polynomial.polyfit(x, y, 1)
coefarray([-1.38690251e-16, 1.70000000e+00])
# creating the polynomial
pol = np.poly1d(coef)
pol
poly1d([-1.38690251e-16, 1.70000000e+00])
_y_fit = np.polyval(coef, x) # another method
_y_fit
array([1.7, 1.7, 1.7, 1.7])
# fitted y_axis
y_fit = pol(x)
import matplotlib.pyplot as pltplt.scatter(x, y, label="Data points")
plt.plot(x, y_fit, label="fitted line")
plt.xlabel("x")
plt.ylabel("y")
plt.legend()
plt.show()
print(y_fit)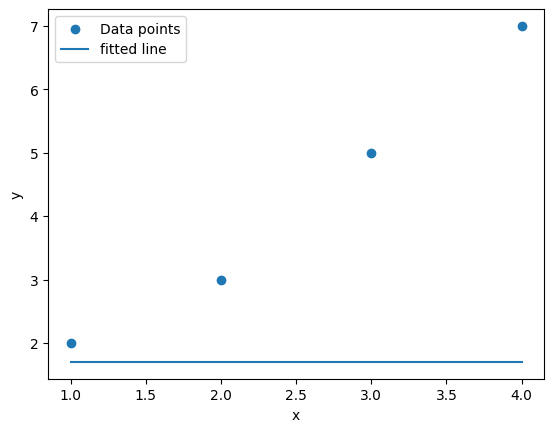
[1.7 1.7 1.7 1.7]
Outputs
-
poly1dcreates the polynomial with takes a list coefficients. The number of coefficients determine the degree of the polynomial. The resultant polynomial can be evaluated by calling it as a function and passing value ofx. -
np.polyvalandnp.polynomial.polynomials.polyvalwork different and give different results. See the section ofpolyval. -
for
polyfit, need a better data points to work with.