Dask Dashboard
Dask dashboard provides details of the distributed computations, workers, and cluster resource usages.
Dashboard provides different diagnosis plots, some of them are:
- Bytes stored and Bytes per worker
- Task processing/CPU utilization/Occupancy/Data Transfer
- Task Stream
- Progress
Bytes stored and Bytes per worker
These plots provides overall memory utilization of the cluster and individual workers. There are four different colors to describe different memory utilizations.
- Blue when memory is under the target which is 60% of memory available.
- Orange when memory is used 70% and is close to spilling to disk.
- Red when at least one worker is paused due to the memory usage 80% of available memory.
- Dark gray shows the memory spilled to disk.
 |
|---|
| Figure: Memory utilization |
| The different transparency in the plots shows memory management levels such as managed, unmanaged old and unmanaged recent. |
Task processing/CPU utilization/Occupancy/Data Transfer
This plots detail task being processed by workers, their CPU utilization, occupancy which is the amount of time dask expects worker to finish all the tasks, data transfer from/to other workers.
Task Stream
Task stream plot shows the tasks getting executed on each thread. Rows in the plot are threads and different color rectangular boxes are individual tasks. Tasks with same prefix will have same color as defined in progress bar plot. For example, tasks with prefix inc will have some color in the task stream.
However, these following colors are reserved for specific kind of operations.
- Light red shows the data transfer between workers.
- Light orange shows read and writing the disk.
- Light gray shows serialize/deserialize of the data.
- Black shows some error.
White spaces among the tasks shows idle time of the threads. Having many white spaces and red bars show unoptimized execution.
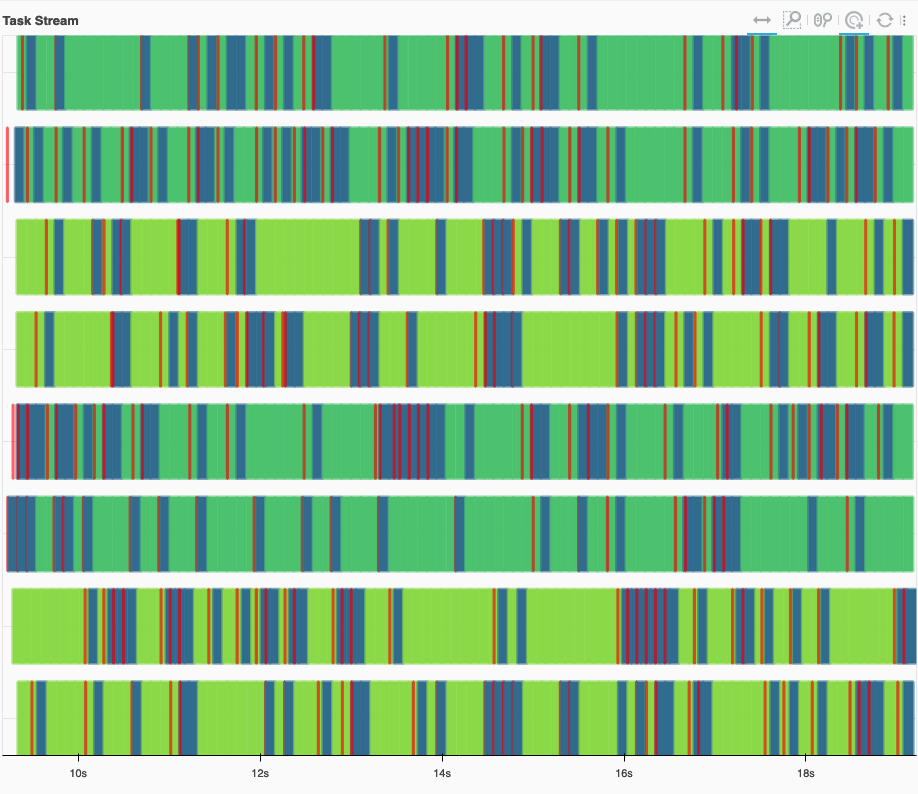 |
|---|
| Figure: Healthy tasks stream. |
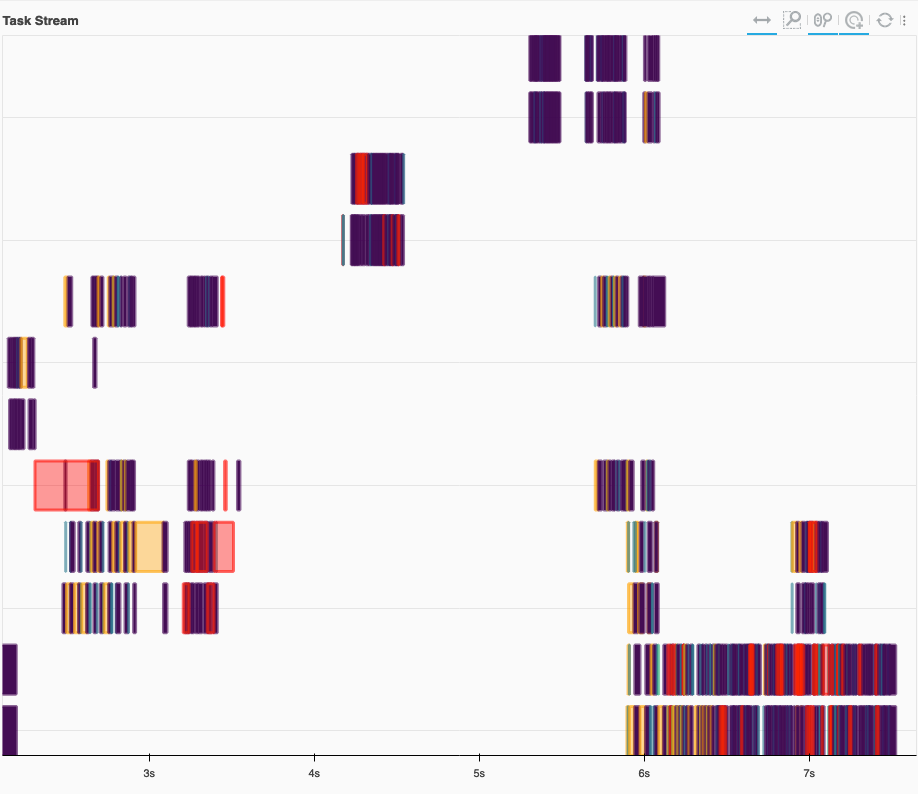 |
|---|
| Figure: Unhealthy tasks strem. |
Progress bar
This shows the progress of each individual task prefix.